5 essential tips to support student reading success with Sora reports & data
By: Gabby Cregan, Instructional Designer
Whether your school year is almost over or it’s just begun, OverDrive Marketplace has reading data and insights to help you better understand how, when, why, and how much your students are using Sora.
We asked your OverDrive Account team to share their favorite tips for using reports, Sora activity, and student reading data for the end of the school year – or anytime!
Check students’ reading time.
 The Sora activity dashboard offers at-a-glance insight into your students’ behavior and progress in the app – including reading time! Here are some ways to get the most out of this page:
- Filter activity to view data for your individual school branch
- Select a timeframe to see what happened when
- Hover over interactive graphs to view more granular data.
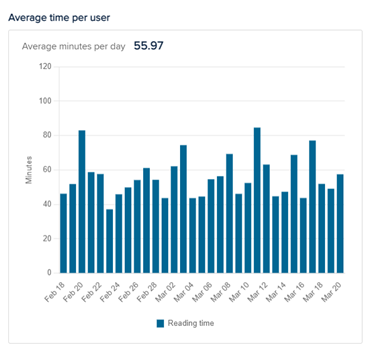
Curious how long your students spend reading in Sora? At a high level, you can view total time read, with detailed data by format. Then, review average time per user to see how long students are reading, on average, per day in Sora.
Looking for a quick summary? Watch this 60-second overview!
See how many students are engaging with your digital collection.
You can see how many students are contributing to the total time read with unique users. This data point shows the number of users who have had at least one reading session during the specified timeframe.
Want to see the impact of your promotion efforts? Wondering if you are reaching new students? Under the Achievements section, look at the number of users who have earned the Blast Off Badge during this period. This indicates the number of students who are brand new to Sora and have logged in for the very first time!
Review checkout data.
Checkout data can help stakeholders better understand Sora usage. Under Sora activity, you’ll find the top 10 titles by checkout, and the number of checkouts for each.
Want to see which titles are keeping students’ attention? Review the top 10 titles by time read. Remember that Sora activity displays data based on the school branch you choose, and the period you specify.
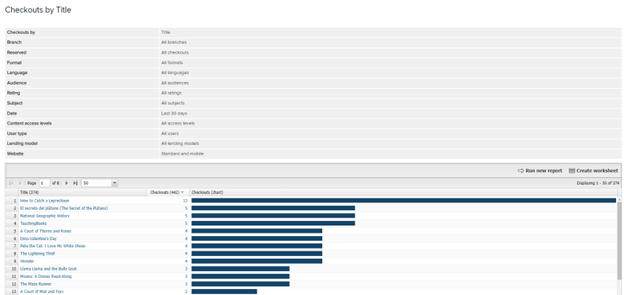
You can also run a Checkouts report to glean information about your checkouts during a given timeframe. When you run the report, you’ll choose to view your checkouts by branch (if applicable), day, month, year, publisher, format, title, subject, or creator. For instance, I can run a checkouts report to view which titles my students have checked out in the past 30 days, and how many checkouts each title has received.
 View year-over-year growth.
View the Trends dashboard to see how your digital collection’s activity has changed over time.
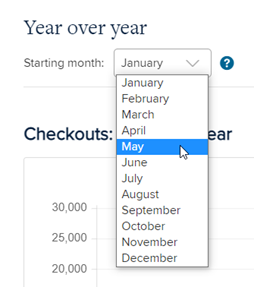
Select a starting month for year-over-year (YoY) charts. You can see changes in checkouts, holds, and unique users over time. Hover over data points for more information about user activity.
Use the Save PDF button to download these charts for your own records.
Get details with the student dashboard.
Want to learn more about your class or a specific student? With the student dashboard, you can view student data points such as total time read and number of books opened. Educators create classes in the dashboard to organize and view Sora reading data for their students.
At the class level, you can view and compare the following data points for individual students:
- books opened
- time read
- reading sessions
- active days
- average time per session
- average time per book
- achievements earned
Filter the dashboard to view data for specific class(es) and a specified timeframe.
Or select an individual user to view more granular details about their progress, such as reading data for assigned titles (includes On-Demand Class Sets).
Student data is available for up to 365 days and resets each year on a specified date. Once the dashboard resets, previous data will no longer be available. However, educators can export data as a worksheet or PDF to view offline prior to the reset date, making it available for future reference.
Note: The student dashboard must be enabled before you can create classes or view data. Marketplace admin users with specific permissions can enable the dashboard for your digital collection. Dashboards and reports are available under the INSIGHTS tab in OverDrive Marketplace. Specific user permissions are required to view this tab and access specific reports. Reach out to the main Sora contact at your school, your Sora Account Manager or asksora@overdrive.com with questions.
Ready to learn more?
Check out our on-demand webinar, Advocate for Your Digital Collection with Data and Insights, today!
Looking for live training? Join us for our April webinars:
- AudioFile and OverDrive present: SYNC Audiobooks for Teens 2023– April 18 at 2 PM ET
- Sora Essentials: The Reader Experience– Daily, April 17 through May 12
- Marketplace Essentials: The Shopping & Admin Portal– Weekly, April 20 through May 10